Data Analysis Pipeline for a Global Tree Restoration Portfolio

Development of a complex, multi-stage pipeline in R that preprocesses, wrangles, and analyzes all incoming monitoring data, as well as performs crucial functions in quality control and in ensuring best ecological practices.
Overview
Conservation International (CI) was hired by MasterCard to oversee the tree restoration projects as a part of the Priceless Planet Coalition’s efforts to restore 100 million trees by 2025. Tree restoration–as opposed to simply ‘tree planting’–implies that these trees are sustainably restored, having survived many years after planting and become a part of local ecosystems.
In order to ensure this, CI developed an extensive monitoring protocol that project partners must follow. This protocol involves the systematic sampling of restoration sites and regular field visits to these sites to monitor for the tree species present and the size classes of the trees.
Certain key indicators will need to be measured in order to analyze project success, such as the survival rate of planted trees and the number of trees restored (a count of planted trees and the trees that naturally regenerate as a result of these plantings). The various projects around the world are using numerous methods for restoration and planting a variety of different types of species. This dataset, then, will not only be a useful tool in evaluating project success, but could serve to build useful models that help predict what types of species and conditions lead to the most successful restoration outcomes.
My Job
I was hired as a consultant to create a pipeline that could take the raw data input by the project partners during their tree monitoring phases and ultimately generate indicators like the ones mentioned above. While that might sound simple, any data scientist will likely know that the word ‘raw’ often implies messy, inaccurate, and sometimes unintelligible. This isn’t anyone’s fault, it is the nature of working with real world data–especially data streaming in from so many sources around the world. Adding to the complexity (and fun) of this job, were some added issues that I was asked to explore: functionality to scan the entire dataset for potentially invasive species, a way to classify plants as alien or native in the regions where they are being planted, and ways to handle missing taxonomic information or innacurrate inputs in the family, genus, or species fields.
The Pipeline
I won’t go into too much depth about the whole pipeline here–you can look at it yourself on my GitHub. Instead, I will provide a general overview of all scripts, link to them in their sections, and provide links to other posts where I discuss the methods I employed in more depth.
Extraction -
The data from each restoration partner was collected using KoboCollect and stored on KoboToolbox. Luckily, there is an API with pretty clear documentation. Even more luckily, someone else already made an R package called ‘robotoolbox’ which streamlined this even further.
Along with getting the data out, however, I had to parse out how Kobo’s internal labels mapped onto actual project parameters to give fields clear names for human eyes. The forms to collect data had gone through many iterations/versions during deployment, which created some abberant tables and fields that also needed to be handled. In addition to this, I had to read and understand the actual tree monitoring protocol extensively in order to initiate variables that would later be essential in computing the key indicators. Translating this understanding of what was happening on the ground–the science behind the data collection and monitoring effort–to how this should be reflected on the screen in the pipeline made up a major part of this script.
The result was the complete dataset with clear labels, many added fields, reshaped and reorganized for further processing. The data was saved in a preset directory strucutre to the user’s disk, where subsequent scripts would locate and upload it for further processing.
Taxonomic corrections -
Link to Taxonomic Corrections Script Link to Taxonomic Family Script
Tree species formed the foundation of this monitoring data, and scientific names are notoriously difficult to spell correctly (and to know at all!). The data collection form had a completely open text input field here, so the errant entries ranged from minor misspellings to common names in a variety of languages to random words.
While some of these, like random words, are not systematically correctable–through the use of API calls to databases and existing tools like the Global Names Resolver–I was able to develop script that dramatically cut down the need for manual correction (which in a huge dataset like this would have been extremely arduous).
These corrected names are crucial not only for accuracy in the final analyses–where you want to clearly be able to associate all entries of a given species with the same species name–but also because later functions will assume well-formed scientific names when searching databases online for relevant information.
Here is an example incoming and outgoing species names:
| User input | Corrected Name | Database used |
|---|---|---|
| Albizia lebbeck | Albizia lebbeck | Tropicos - Missouri Botanical Garden |
| Albbizia lebbeck | Albizia lebbeck | Tropicos - Missouri Botanical Garden |
| Albezia lebbeck | Albizia lebbeck | Tropicos - Missouri Botanical Garden |
| Albizia Lebbeck | Albizia lebbeck | Tropicos - Missouri Botanical Garden |
| Albizia lebeck | Albizia lebbeck | Tropicos - Missouri Botanical Garden |
This table just shows a few mispellings of a single species, so you can imagine the number of corrections needed in a database where thousands of species are being used across many different sites.
After correcting species names, I then wrote script to use these now-well-formed names to check a database for further taxonomic information like family (which was not a field in the monitoring form). For this, I used API calls to the Global Biodiversity Information Facility, which allowed me to rapidly identify the species entry within this database by scientific name and extract its taxonomic family name, which I appended to the dataset.
Generating Indicators
These final indicators, though simple in theory, were a challenge to generate. The monitoring data was very complex. The collection form allows for all sorts of different scenarios on the ground. For example, if the orginally randomly sampled monitoring plot had no trees greater than 10cm in diameter at breast height (DBH), then another plot was sampled randomly. If this plot had trees that were greater than 10cm DBH, then this plot was used. If not, another plot was selected. In the case where this third plot still had no trees, then the entire plot would be censused for smaller trees (between 1cm - 9.9 cm DBH). In each plot, 3x3 meter subplots were sampled with a similar logic.
While the details of this protocol are not important to understand here, I mention it to illustrate the many ways I had to translate the specific details in the monitoring protocol into clear, programattic logic that produced accurate metrics.
Invasive Species Scanner
Link to Invasive Species Script
CI made commitments that ensured no project parter would plant invasive species. With so many organizations doing the planting and fieldwork, this posed a challenge. They asked me to research and explore ways to do this automatically, which I did. The tool I developed combines API calls and webscraping techniques to generate a report on potentially invasive species in the dataset.
For CI’s version of this tool, this report included specific organizations and countries that were flagged in the scan. I also developed a general-use, simple version of the tool which I have embdedded below. I wrote a short post about this as well, called Invasive Species Scanner.
Native/Alien Classification Workflow
Link to Native/Alien Classification Script
This task proved more difficult to fully automate. Because of the potential harm that invasive species can cause, there are clear global databses tracking them that I was able to tap into to develop the invasive species scanning tool. Many databases exist that list native plants in certain regions, but there was no centralized database that covered all regions, and even finding extensive databases for each of the many country’s in CI’s restoration portfolio proved a challenge. Even if disaprate databases could be found for each country, programatically interacting with them each would require a tailor-made solution for that database alone, so developing script for a portfolio that continues to add new partners in new countries was out of the question. That being said, with the advent of large language models, I was able to create a classification procedure that would be generalizable!
First, though, I will talk aobut the workflow I developed to streamline the process of manually designating a plant species in a given country as native or alien.
Semi-automated workflow for Native/Alien classification
This workflow was executable entirely within the R Studio IDE. It takes every species-country combination in the whole dataset, and passes it through a series of functions that provide the user with textual and geospatial information in order to make a decision about the plant’s status in that country.
For the geospatial information, I once again relied on the GBIF database, which houses millions of records of species occurence data. Some of these datapoints are labelled with the designation of native or alien. For each species, then, I extracted the occurence data and generated a map using the ‘leaflet’ package that color-coded the points as green (native), red (introduced), or blue (unspecified). If plenty of occurence data was present for that species, this resulted in a distribution map with hints about native and alien ranges. Often, this alone was enough to make a designation.
In addition to this geospatial data, I wrote API calls to wikipedia to search for the plant species at hand. Instead of returning the entire page, I preprocessed the text to only include sentences that included certain keywords, like native, introduced, cultivated, endemic, alien, invasive, and so on. This text was then printed into the console for the user to examine. Often, in the first line or two on wikipedia pages for plants, there is enough information to make a clear decision.
After reviewing these two aids, the user could then input into the console their decision, and the script would apply the label directly to the dataset. Screenshots of this workflow are visualized below.
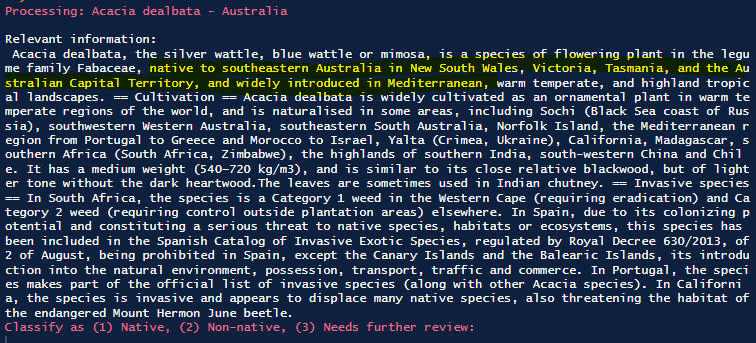

The above screenshots show exapmle outputs for a specific species that is native to parts of Australia and introduced elsewhere. The map and the text both reflect this, allowing the user to make a classification decision rapidly before moving onto the next datapoint.
I will save discussing the LLM-integration for a separate project post, but effectively what I developed was a way that this workflow could be completed by an LLM. I developed this in Python in order to use LangChain, and with careful prompt engineering was able to get the LLM to read the wikipedia text, extract explicit information about the native and alien ranges of the plant, to explicitly state its reasoning steps, and to only make a decision based on this provided context in order to avoid hallucinations (a problem where LLMs simply make something up). Without a ground truth comparison available, I am not sure how it performed, but initial analyses its decisions looked very promising.
Conclusion
This data science consultancy was great. It not only allowed me to lean on my exisitng skillset to make meaningful, measurable contributions to a major conservation organization’s goals, but it allowed me to explore new ideas and methods for getting things done. I love being faced with clear problems that may or may not have programmatic solutions. It forces me to think outside the box and develop tools using methods I had never considered before.